Deviation
If any analytical tools were utilized during the data processing phase, it is expected that the corresponding platform be acknowledged in the published manuscript.
Run the tool first...
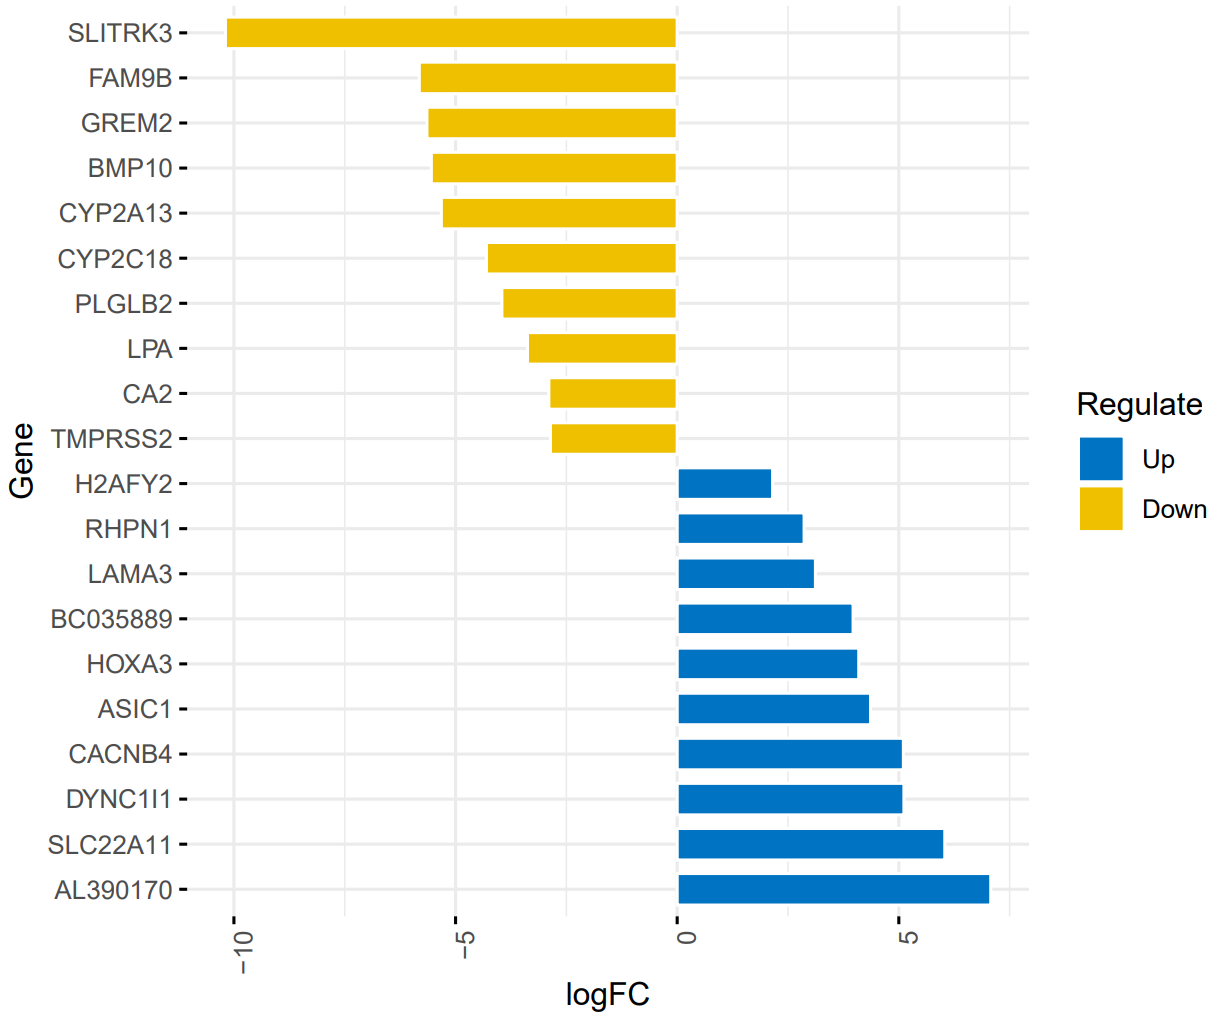
偏差图是一种用于展示数据点与特定值(如均值、理论值或目标值)之间差异的图表。它可以帮助我们直观地了解数据的分布情况,特别是数据点偏离特定值的程度。偏差图在统计和数据分析中非常有用,可用于评估模型的拟合度、衡量数据的精确性等。
输入文件

第一列是基因名称,第二列是 logFC 值,两列之间以制表符(\t)分隔。
输出文件

A deviation plot is a type of chart used to display the differences between data points and a specific value (such as the mean, theoretical value, or target value). It helps us intuitively understand the distribution of the data, especially the extent to which data points deviate from the specific value. Deviation plots are very useful in statistics and data analysis, and can be used to assess the fit of models, measure the precision of data, and more.
Input
The first column is the gene name, and the second column is the logFC value, separated by a tab character (
\t).Output