KEGG Circos
Run the tool first...
KEGG 圈图是用于展示 KEGG 富集分析结果的可视化工具。它通常由多个同心圆环(track)组成,每个圆环代表不同的信息。
输入文件
第一列是“gene”,第二列是“logFC”,它们之间用制表符(\t)分隔。

输出文件

图表内容说明
1. KEGG圈图(Chord Diagram)
- 图形结构:
- 连线(Chord):
- 颜色与标签:
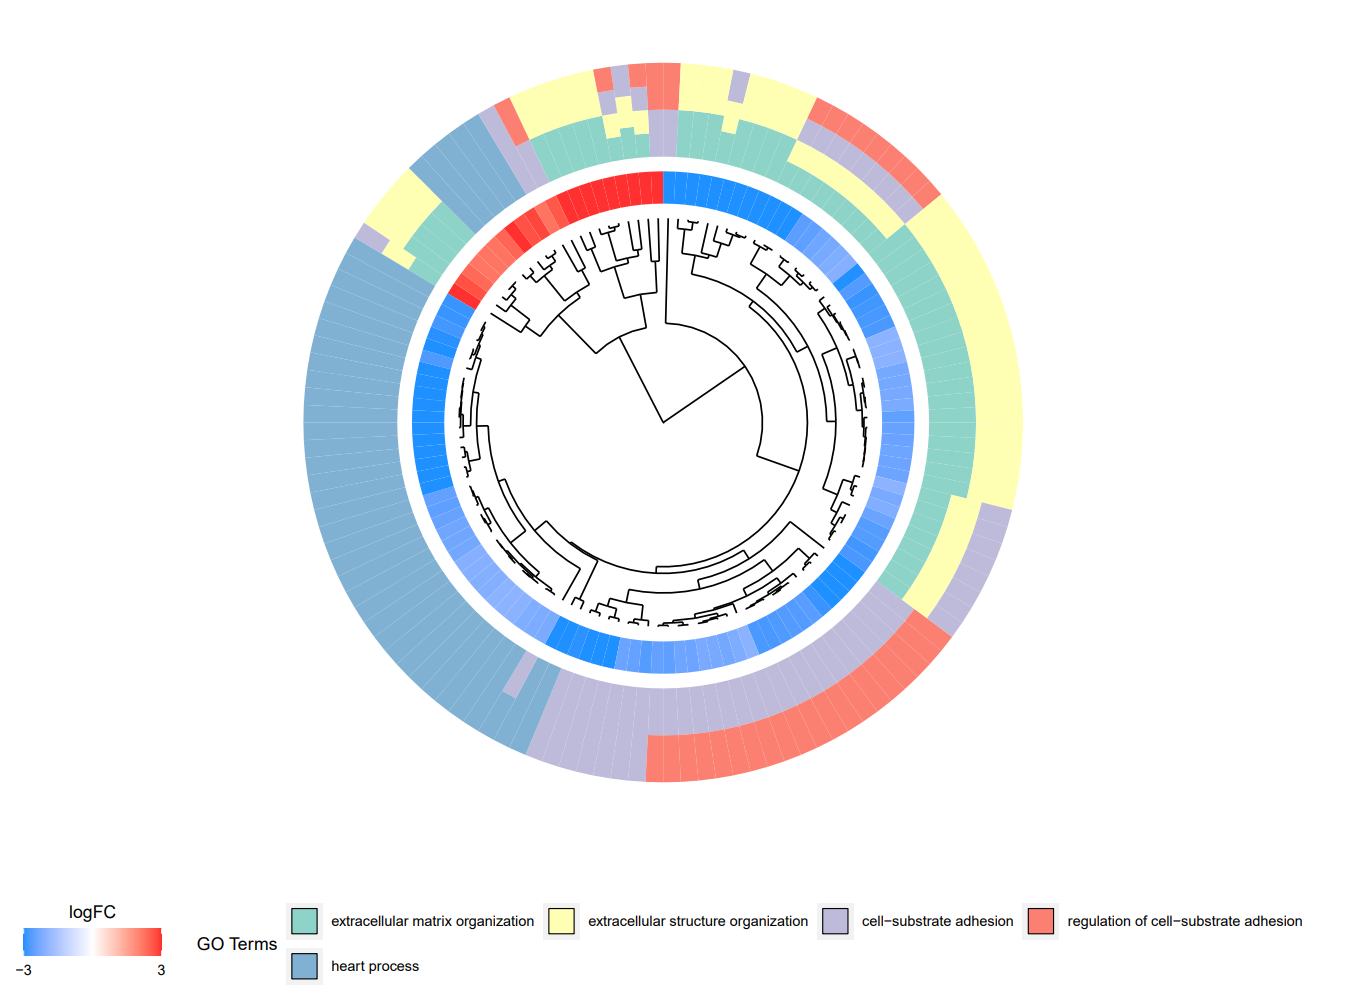
2. KEGG聚类圈图(Cluster Diagram)
- 图形结构:
- 用途:
A KEGG circle plot is a visualization tool used to display the results of KEGG enrichment analysis. It typically consists of multiple concentric circles (tracks), with each circle layer representing different information.
Input
The first column is "gene", the second column is "logFC", and they are separated by a tab character (\t).
Output
Chart Description
1. KEGG Chord Diagram
Structure:
-
The KEGG chord diagram is based on a circular layout.
-
One side of the outer ring represents significantly enriched KEGG pathways (Terms), while the opposite side displays the input genes.
Connections (Chords):
-
Each chord connects a KEGG pathway to a gene, indicating that the gene is annotated/enriched in that pathway.
-
These connections visually reveal which genes participate in which pathways and whether different pathways share common genes.
Colors & Labels:
-
Different KEGG pathways and genes are distinguished by unique colors.
2. KEGG Cluster Diagram
Structure:
-
The cluster diagram groups KEGG pathways based on functional similarity or gene overlap, illustrating relationships and similarities between pathways.
Purpose:
-
Helps identify functionally related pathways or those with significant gene overlap.
-
Aids in understanding the overall structure of biological processes.