Nomo
Run the tool first...
列线图(Nomogram),又称诺模图,是一种基于多变量回归分析的图形工具。它将多个预测指标整合在同一平面上,直观地展现预测模型中各变量间的相互关系。
输入文件
输入文件的中间部分以制表符(\t)分隔,如下图所示

输出文件

1. 列线图(Nomogram)—— output.svg
- 图形结构:
- 使用方法:
- 用途:
Nomogram, also known as nomograph, is a graphical tool based on multivariate regression analysis. It integrates multiple predictive indicators onto the same plane to visually express the interrelationships between various variables in a predictive model.
Input
The input file is shown in the figure below, with the middle part separated by \t
Output
-
Nomogram - output.svg
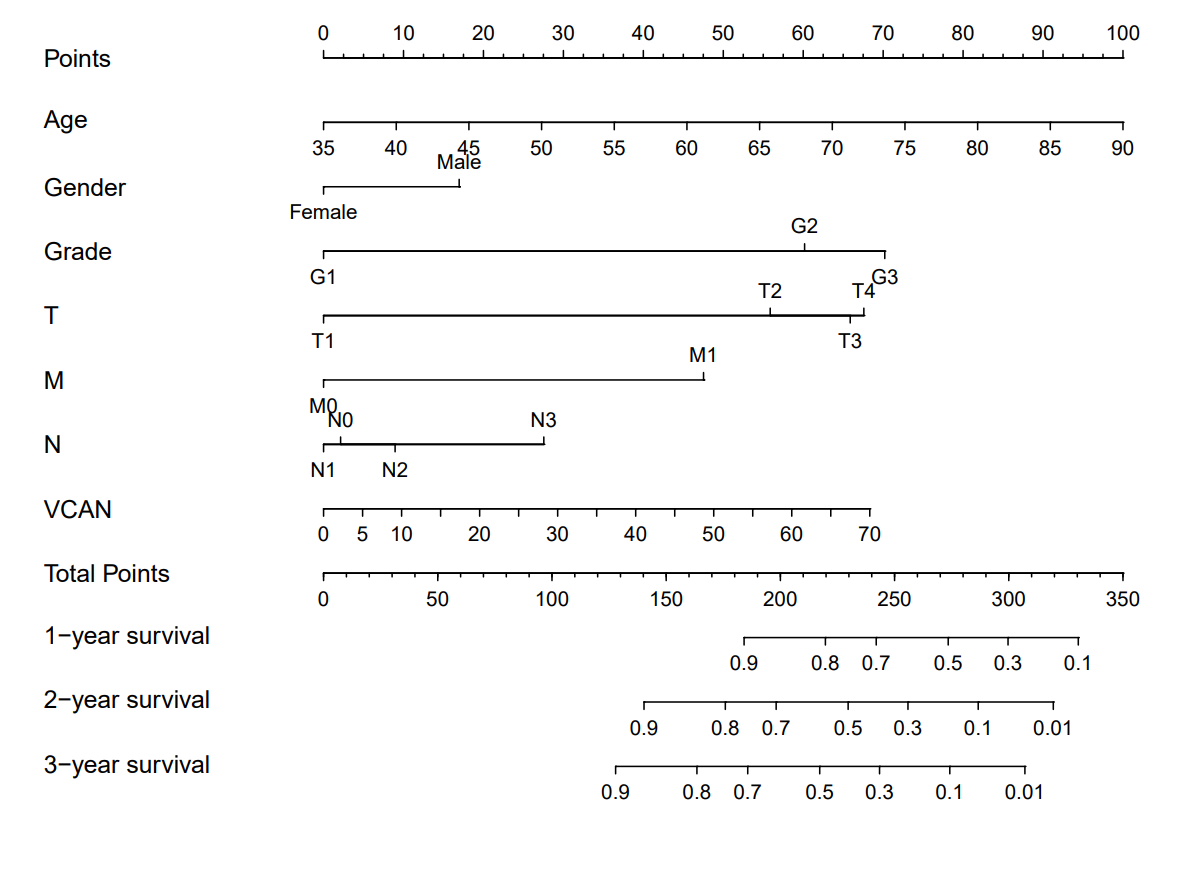
Graphical Structure:
The nomogram is an intuitive multifactorial survival prediction tool. Each row represents a clinical variable (e.g., Age, Gender, Grade, T, M, N, VCAN), with the topmost scale being the "Points" axis.
Usage Method:
For each patient, locate their value on each variable, draw a vertical line to the "Points" axis to obtain the corresponding score. Sum the scores of all variables to get the total points ("Total Points"), then find the corresponding survival probability on the "1-year/2-year/3-year survival" axis at the bottom. This represents the predicted survival probability for the patient at 1, 2, and 3 years.
Purpose:
Enables clinicians or researchers to make individualized survival predictions for patients based on a multifactorial model.