RDA-CCA
Run the tool first...
冗余分析与典型相关分析联用(RDA-CCA)是一种研究环境因子和群落结构间关系的方法。它借助降维揭示数据模式,并评估变量间的相关性。
输入文件
环境因子表是一个包含行和列表头的制表符分隔文本文件。每一行代表一个样本,第一列列名固定为SampleID,第二列是组别(列名固定为Category),第三列及以后的每一列代表一个环境因子。

一个包含行和列标题的制表符分隔文本文件,其中每一行代表一个物种(唯一且不重复),每一列代表一个样本。

输出文件

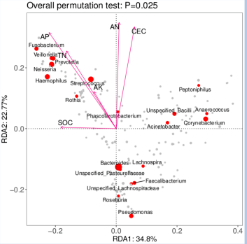
环境因子以箭头表示。箭头所在象限显示环境因子与排序轴的正负相关性。箭头与原点连线的长度反映环境因子与群落及物种分布的相关性:线长相关性强,线短相关性弱。箭头连线与排序轴(如 RDA1 和 RDA2,即第一和第二主成分)的夹角反映环境因子与排序轴的相关性:夹角越小相关性越高,夹角越大相关性越低。
RDA-CCA analysis is a method combining Redundancy Analysis (RDA) and Canonical Correlation Analysis (CCA) to study the relationship between environmental factors and community structure. It reveals patterns in data through dimensionality reduction and assesses correlations between variables.
Input
Environmental Factors Table A tab-separated text file containing row and column headers, where each row represents a sample, The first column header must be 'SampleID', and the second column must be named 'Category' (for group classification), and from the third column onwards, each column represents an environmental factor.
A tab-separated text file containing row and column headers, where each row represents a species (unique and non-repeating), and each column represents a sample.
Output
Environmental factors are represented by arrows. The quadrant in which the arrow is located indicates the positive or negative correlation between the environmental factor and the ordination axis. The length of the line connecting the arrow to the origin represents the degree of correlation between a certain environmental factor and the community and species distribution. The longer the line, the greater the correlation; conversely, the shorter the line, the smaller the correlation. The angle between the arrow's line and the ordination axis (RDA1 and RDA2, the first and second principal components) represents the degree of correlation between the environmental factor and the ordination axis. The smaller the angle, the higher the correlation; conversely, the larger the angle, the lower the correlation.