Ternary Plot
Run the tool first...
在微生物组研究中,三元图常用于展示不同样本中微生物群落的相对丰度。例如,可用于比较土壤、根际和内生环境等不同环境中的微生物组成。借助三元图,能够直观地展示每个样本中不同微生物类群的相对比例,帮助研究人员分析微生物群落的结构与分布。
输入数据要求
- 第1列:染色体名称(如chr1, chr2, chrX, chrY等)
- 第2列:起始位置(基因组坐标)
- 第3列:结束位置(基因组坐标)
- 第4列:数值(如表达量、突变频率等)

输出文件

结果图形解读
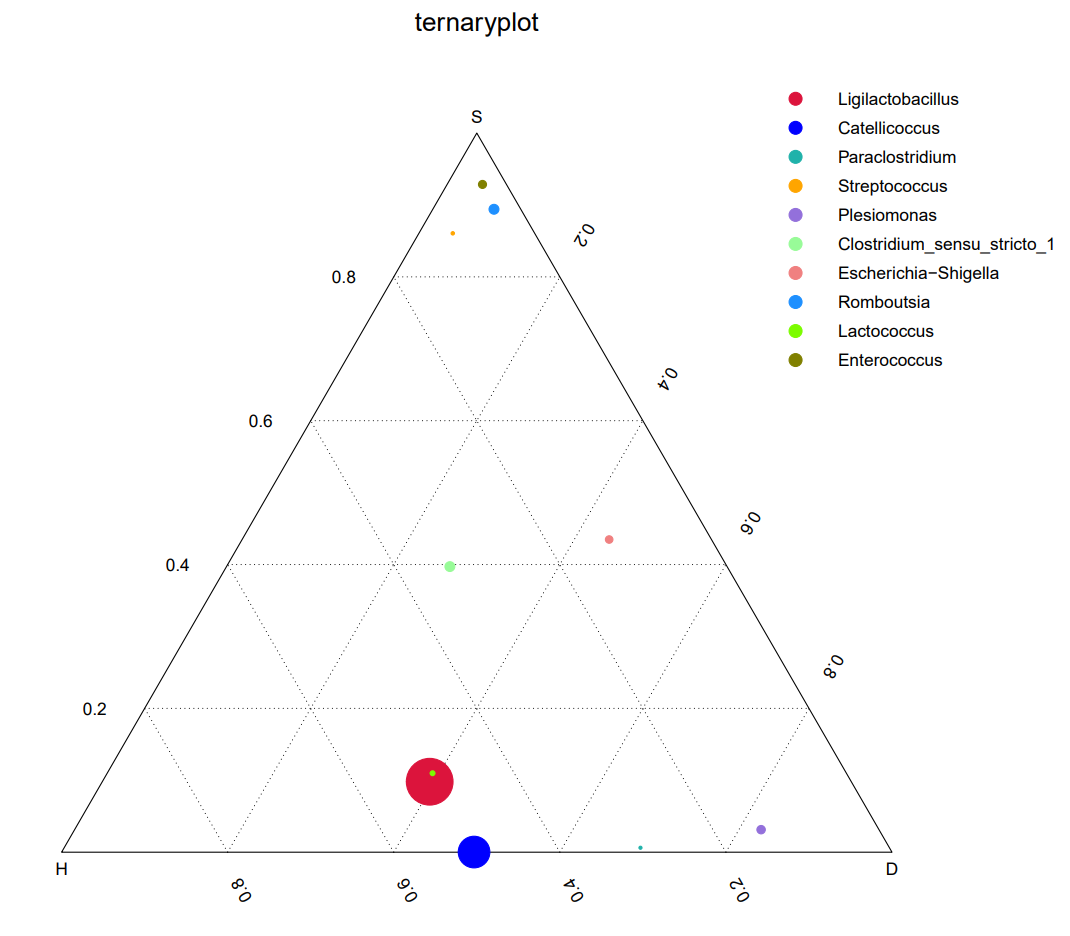
如何解读三元图
- 三角形的三个顶点:分别代表三个组分(如A、B、C)。每个顶点表示该组分的比例为100%。
- 每个点的位置:代表一个样本在三个组分中的比例关系。
- 如果一个点靠近某个顶点,说明该样本在该组分上的比例很高,其他两个组分比例较低。
- 如果一个点靠近三角形的边,则说明该样本在对应的两个组分上占比高,第三个组分占比低。
- 如果一个点位于三角形的中心,说明该样本在三个组分中的比例大致相等。
- 点的颜色:不同颜色代表不同的样本,便于区分。
- 图例:右上角图例标注了每个样本的名称及其对应颜色。
In microbiome research, ternary plots are often used to display the relative abundance of microbial communities in different samples. For instance, they can be used to compare the microbial composition in different environments such as soil, rhizosphere, and endophytic environments. With the help of ternary plots, the relative proportions of different microbial taxa in each sample can be visually demonstrated, assisting researchers in analyzing the structure and distribution of microbial communities.
Input Data Requirements
File Format: Tab-separated values (.tsv or .txt) with column headers in the first row.
Columns:
-
Column 1: Sample name
-
Columns 2-4: Proportions or abundances of three components (recommended to be normalized values summing to 1)
output
How to Interpret a Ternary Plot
-
Three Vertices of the Triangle:
-
Each vertex represents one component (e.g., A, B, C).
-
A vertex indicates 100% proportion of that component.
-
-
Position of Each Point:
-
Represents the proportional relationship of a sample across the three components.
-
Close to a vertex: The sample has a high proportion of that component and low proportions of the other two.
-
Close to an edge: The sample has high proportions of the two corresponding components and a low proportion of the third.
-
Near the center: The sample has roughly equal proportions of all three components.
-
-
Point Colors:
-
Different colors represent different samples for easy distinction.
-
-
Legend:
-
The legend in the upper-right corner labels each sample name and its corresponding color.
-