
火山图
v1.0.0
Run the tool first...
1.输入文件
输入数据包含三列,第一列为基因名称,第二列为logFC值,第三列为P值或调整后的P值。

2.输出文件
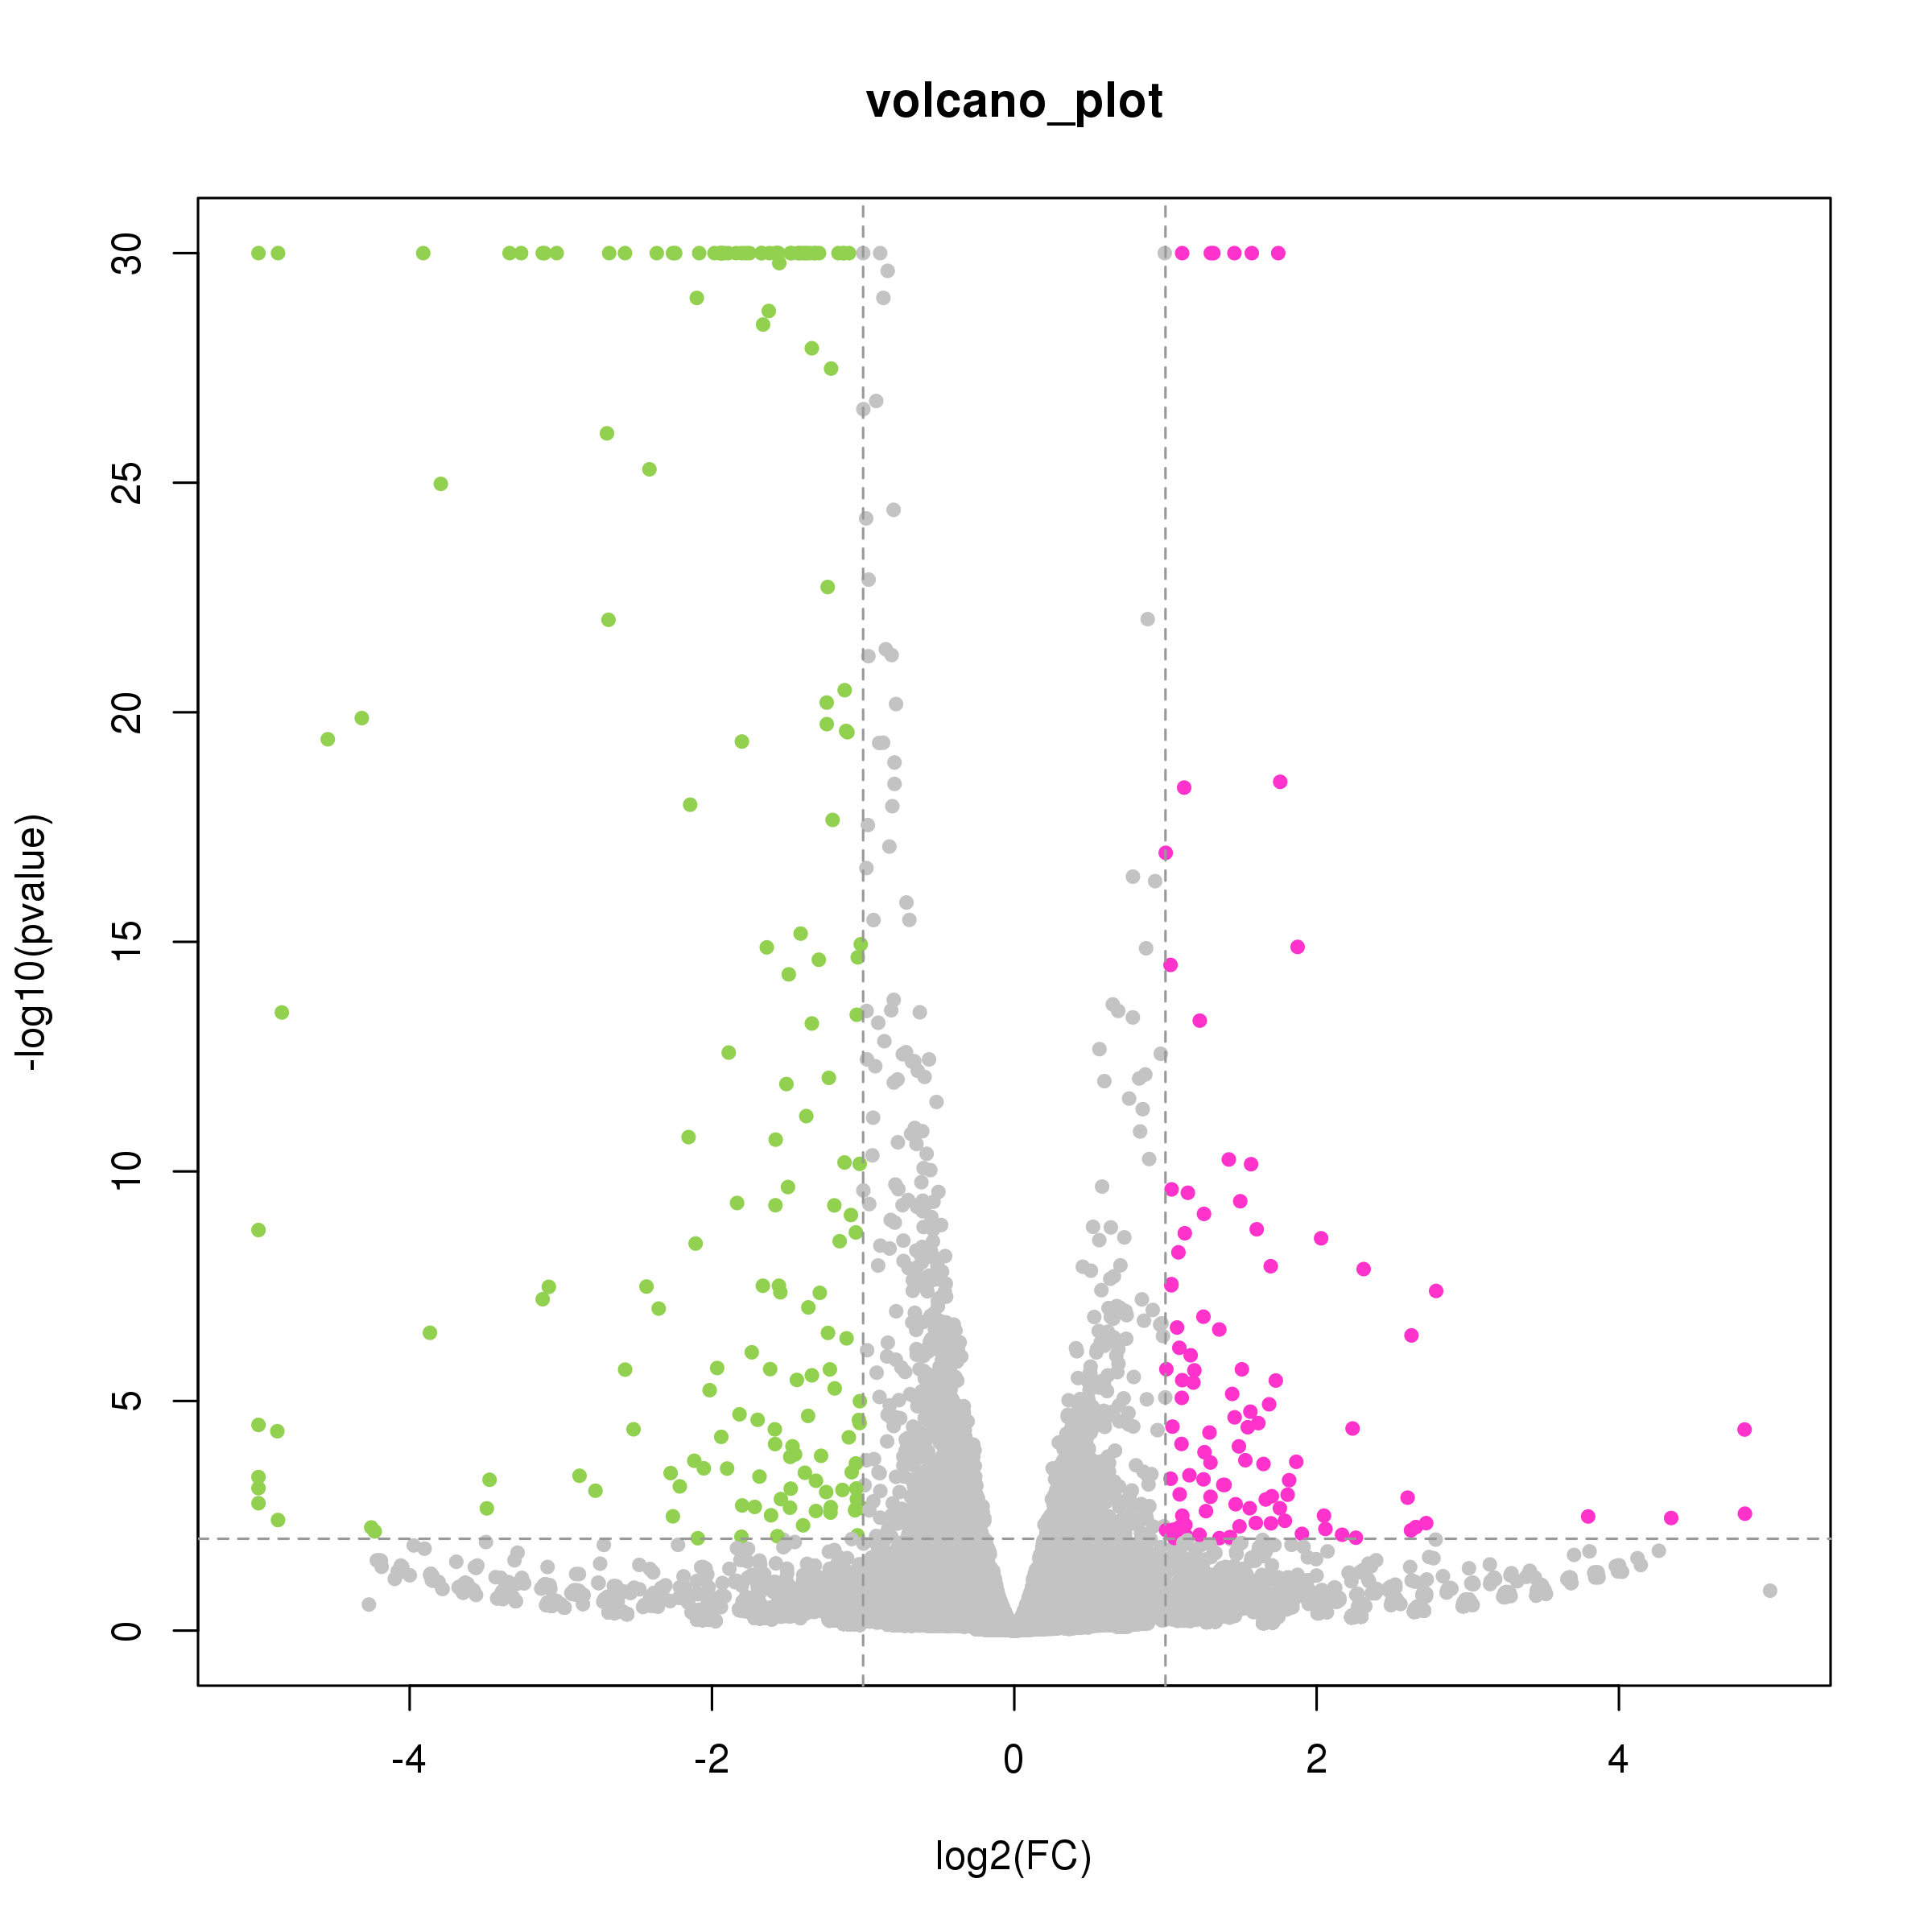
3.图例描述
x轴为以2为底的对数倍变化(log2(FC)),y轴为显著性检验P值或FDR值的负对数(以10为底),即-log10(p)或-log10(FDR)。点的不同颜色表示两组样本间差异的显著性。左上角和右上角的点分别代表表达差异非常显著的下调基因和上调基因,未着色的点表示基因差异不显著。
v1.0.0
Run the tool first...
1.输入文件
输入数据包含三列,第一列为基因名称,第二列为logFC值,第三列为P值或调整后的P值。
2.输出文件
3.图例描述
x轴为以2为底的对数倍变化(log2(FC)),y轴为显著性检验P值或FDR值的负对数(以10为底),即-log10(p)或-log10(FDR)。点的不同颜色表示两组样本间差异的显著性。左上角和右上角的点分别代表表达差异非常显著的下调基因和上调基因,未着色的点表示基因差异不显著。